Wednesday, March 10, 2010

Biodiversity Loss (Endangered, Threatened and Extinct Species)

Massive Extinctions From Human Activity

As well as the need for biodiversity for continued ecosystem survival (as explained in the Who Cares? section on this web site), from a human perspective, from common drugs to possible cures for cancers, most of our medicine come from plants, many of which are now endangered.

However, it has long been feared that human activity is causing massive extinctions. The previous link, to a report from Environment New Service (August 2, 1999) says that “The current extinction rate is now approaching 1,000 times the background rate and may climb to 10,000 times the background rate during the next century, if present trends continue. At this rate, one-third to two-thirds of all species of plants, animals, and other organisms would be lost during the second half of the next century, a loss that would easily equal those of past extinctions.” (Emphasis added)

A huge report known as the Millennium Ecosystem Assessment, started in 2000, was released in March 2005. Amongst many warnings for humankind, it noted that there has been (as summarized from the BBC) a substantial and largely irreversible loss in the diversity of life on Earth, with some 10-30% of the mammal, bird and amphibian species currently threatened with extinction, all due to human actions. (See this site’s section on sustainable development for more on that assessment.)

A report from the World Wide Fund for Nature (WWF) in 2006 confirmed concerns from the previous year, noting that

Already resources are depleting, with the report showing that vertebrate species populations have declined by about one-third in the 33 years from 1970 to 2003. At the same time, humanity’s Ecological Footprint—the demand people place upon the natural world—has increased to the point where the Earth is unable to keep up in the struggle to regenerate.

Human footprint too big for nature, WWF, October 24, 2006 (Emphasis added)

The International Union for Conservation of Nature (IUCN) notes in a video that:

  • 1 bird out of 8,
  • 1 mammal out of 4,
  • 1 conifer out of 4,
  • 1 amphibian out of 3, and
  • 6 marine turtles out of 7, are all threatened with extinction

In addition,

  • 75% of genetic diversity of agricultural crops has been lost
  • 75% of the world’s fisheries are fully or over exploited
  • Up to 70% of the world’s known species risk extinction if the global temperatures rise by more than 3.5°C
  • 1/3rd of reef-building corals around the world are threatened with extinction
  • Every second a parcel of rainforest the size of a football field disappears
  • Over 350 million people suffer from severe water scarcity

Is this the kind of world we want, it asks? After all, the short video concludes, our lives are inextricably linked with biodiversity and ultimately its protection is essential for our very survival:

What kind of world do we want?, IUCN, December 2008

Research of long term trends in the fossil record suggests that natural speed limits constrain how quickly biodiversity can rebound after waves of extinction. Hence, the rapid extinction rates mean that it could take a long time for nature to recover.

Consider the following observations and conclusions from established experts and institutions summarized by Jaan Suurkula, M.D. and chairman of Physicians and Scientists for Responsible Application of Science and Technology (PSRAST), noting the impact that global warming will have on ecosystems and biodiversity:

The world environmental situation is likely to be further aggravated by the increasingly rapid, large scale global extinction of species. It occurred in the 20th century at a rate that was a thousand times higher than the average rate during the preceding 65 million years. This is likely to destabilize various ecosystems including agricultural systems.

…In a slow extinction, various balancing mechanisms can develop. Noone knows what will be the result of this extremely rapid extinction rate. What is known, for sure, is that the world ecological system has been kept in balance through a very complex and multifaceted interaction between a huge number of species. This rapid extinction is therefore likely to precipitate collapses of ecosystems at a global scale. This is predicted to create large-scale agricultural problems, threatening food supplies to hundreds of millions of people. This ecological prediction does not take into consideration the effects of global warming which will further aggravate the situation.

Industrialized fishing has contributed importantly to mass extinction due to repeatedly failed attempts at limiting the fishing.

A new global study concludes that 90 percent of all large fishes have disappeared from the world’s oceans in the past half century, the devastating result of industrial fishing. The study, which took 10 years to complete and was published in the international journal Nature, paints a grim picture of the Earth’s current populations of such species as sharks, swordfish, tuna and marlin.

…The loss of predatory fishes is likely to cause multiple complex imbalances in marine ecology.

Another cause for extensive fish extinction is the destruction of coral reefs. This is caused by a combination of causes, including warming of oceans, damage from fishing tools and a harmful infection of coral organisms promoted by ocean pollution. It will take hundreds of thousands of years to restore what is now being destroyed in a few decades.

…According to the most comprehensive study done so far in this field, over a million species will be lost in the coming 50 years. The most important cause was found to be climate change.

…NOTE: The above presentation encompasses only the most important and burning global environmental problems. There are several additional ones, especially in the field of chemical pollution that contribute to harm the environment or upset the ecological balance.

Jaan Suurkula, World-wide cooperation required to prevent global crisis; Part one— the problem, Physicians and Scientists for Responsible Application of Science and Technology, February 6, 2004 [Emphasis is original]

Additionally, as reported by UC Berkeley, using DNA comparisons, scientists have discovered what they have termed as an “evolutionary concept called parallelism, a situation where two organisms independently come up with the same adaptation to a particular environment.” This has an additional ramification when it comes to protecting biodiversity and endangered species. This is because in the past what we may have considered to be one species could actually be many. But, as pointed out by scientists, by putting them all in one group, it under-represents biodiversity, and these different evolutionarily species would not up getting the protection otherwise needed.

Declining amphibian populations

Amphibians are particularly sensitive to changes in the environment. Amphibians have been described as a marker species or the equivalent of “canaries of the coal mines” meaning they provide an important signal to the health of biodiversity; when they are stressed and struggling, biodiversity may be under pressure. When they are doing well, biodiversity is probably healthy.

Unfortunately, as has been feared for many years now, amphibian species are declining at an alarming rate.

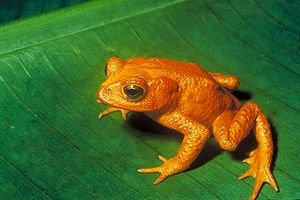
The Golden Toad of Monteverde, Costa Rica was among the first casualties of amphibian declines. Formerly abundant, it was last seen in 1989. (Source: Wikipedia)

Malcom MacCallum of the Biological Sciences Program, Texas A&M University calculated that the current extinction rate of amphibians could be 211 times the background amphibian extinction rate PDF formatted document.

He added that “If current estimates of amphibian species in imminent danger of extinction are included in these calculations, then the current amphibian extinction rate may range from 25,039–45,474 times the background extinction rate for amphibians. It is difficult to explain this unprecedented and accelerating rate of extinction as a natural phenomenon.” (Emphasis added)


Dwindling fish stocks

IPS reports that fish catches are expected to decline dramatically in the world’s tropical regions because of climate change. Furthermore, “in 2006, aquaculture consumed 57 percent of fish meal and 87 percent of fish oil” as industrial fisheries operating in tropical regions have been “scooping up enormous amounts of fish anchovies, herring, mackerel and other small pelagic forage fish to feed to farmed salmon or turn into animal feed or pet food.” This has resulted in higher prices for fish, hitting the poorest the most.

As Suurkula mentioned above, mass extinctions of marine life due to industrialized fishing has been a concern for many years. Yet, it rarely makes mainstream headlines. However, a report warning of marine species loss becoming a threat to the entire global fishing industry did gain media attention.

(Image source: Wikipedia)

A research article in the journal, Science, warned commercial fish and seafood species may all crash by 2048.

At the current rate of loss, it is feared the oceans may never recover. Extensive coastal pollution, climate change, over-fishing and the enormously wasteful practice of deep-sea trawling are all contributing to the problem, as Inter Press Service (IPS) summarized.

As also explained on this site’s biodiversity importance section, ecosystems are incredibly productive and efficient—when there is sufficient biodiversity. Each form of life works together with the surrounding environment to help recycle waste, maintain the ecosystem, and provide services that others—including humans—use and benefit from.

For example, as Steve Palumbi of Stamford University (and one of the authors of the paper) noted, the ocean ecosystems can

  • Take sewage and recycle it into nutrients;
  • Scrub toxins out of the water;
  • Produce food for many species, including humans
  • Turns carbon dioxide into food and oxygen

With massive species loss, the report warns, at current rates, in less than 50 years, the ecosystems could reach the point of no return, where they would not be able to regenerate themselves.

Dr. Boris Worm, one of the paper’s authors, and a world leader in ocean research, commented that:

Whether we looked at tide pools or studies over the entire world’s ocean, we saw the same picture emerging. In losing species we lose the productivity and stability of entire ecosystems. I was shocked and disturbed by how consistent these trends are—beyond anything we suspected.

Dr. Boris Worm, Losing species, Dalhousie University, November 3, 2006

“Current” is an important word, implying that while things look dire, there are solutions and it is not too late yet. The above report and the IPS article noted that protected areas show that biodiversity can be restored quickly. Unfortunately, “less than 1% of the global ocean is effectively protected right now” and “where [recovery has been observed] we see immediate economic benefits,” says Dr. Worm. Time is therefore of the essence.

In an update to the above story, 3 years later, 2009, Dr. Worm was a bit more optimistic that some fish stocks can rebound, if managed properly. But it is a tough challenge “since 80 percent of global fisheries are already fully or over-exploited.”

An example of overfishing that has a ripple-effect on the whole fish-food chain is shark hunting.

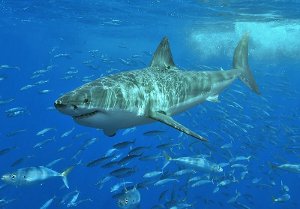
The Great White Shark is the largest predatory fish. (Source: Wikipedia)

Millions of sharks are killed each year from overfishing and trade. Many die accidentally in fishing nets set for tuna and swordfish, while others are caught for their meat or just for their fins.

A demand for shark-fin soup in places like China and Taiwan is decimating shark populations. Shark fin soup is considered a delicacy (not even a necessity) and can be extremely lucrative. So much money can be obtained just from the fin that fishermen hunting sharks will simply catch sharks and cut off their fins while they are alive, tossing the wriggling shark back into the ocean (to die, as it cannot swim without its fin). This saves a lot of room on fishing boats. Some video footage shown on documentaries such as National Geographic reveal how barbaric and wasteful this practice is.

Sharks are known as the “apex predator” of the seas. That is because in general sharks are at the top of the food chain. Without sufficient shark numbers the balance they provide to the ecosystem is threatened because nature evolved this balance through many millennia.

As WWF, the global conservation organization notes, “Contrary to popular belief, shark fins have little nutritional value and may even be harmful to your health over the long term as fins have been found to contain high levels of mercury.”


Declining Ocean Biodiversity

It is not just fish in the oceans that may be struggling, but most biodiversity in the seas. This includes mammals (e.g. whales, dolphins, polar bears), birds (e.g. penguins), and other creatures (e.g. krill).

In the past century, commercial whaling has decimated numerous whale populations, many of which have struggled to recover.

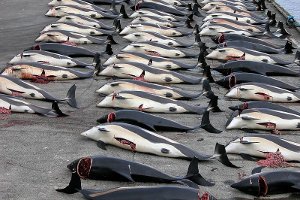
Whaling stations like this one in the Faroe Islands is also used to hold hunted dolphins and other animals. (Image source: Wikipedia)

Commercial whaling in the past was for whale oil. With no reason to use whale oil today, commercial whaling is mainly for food, while there is also some hunting for scientific research purposes.

Large scale commercialized whaling was so destructive that in 1986 a moratorium on whaling was set up by the International Whaling Commission (IWC). As early as the mid-1930s, there were international attempts to recognize the impact of whaling and try and make it more sustainable, resulting in the actual set up of the IWC in 1946. Many commercial whaling nations have been part of this moratorium but have various objections and other pressures to try and resume whaling.

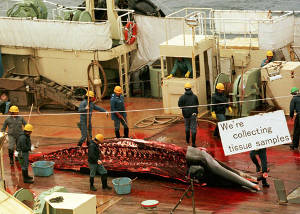
Japan often claims its whale-hunting is for scientific research; the general population are often quite skeptical of such claims. (Image source: © Greenpeace)

Japan is the prime example of hunting whales for the stated aim of scientific research while a lot of skepticism says it is for food. Greenpeace and other organizations often release findings that argue Japan’s whaling to be excessive or primarily for food, and for research as secondary.

General public negativity of commercial whaling has also led to a difference between traditional whaling communities in the arctic region and conservationists. Traditional indigenous communities have typically hunted whale in far smaller numbers commercially, mostly for local food consumption, but the impacts of large-scale commercial whaling has meant even their hunting is under pressure.

Some have argued for whale hunting as a way to sustain other marine populations. National Geographic Wild aired a program called, A Life Among Whales (broadcast June 14, 2008). It noted how a few decades ago, some fishermen campaigned for killing whales because they were apparently threatening the fish supply. A chain of events eventually came full circle and led to a loss of jobs:

  • The massive reduction in the local whale population meant the killer whales in that region (that usually preyed on the younger whales) moved to other animals such as seals
  • As seal numbers declined, the killer whales targeted otters
  • As otter numbers were decimated, the urchins and other targets of otters flourished
  • These decimated the kelp forests where many fish larvae grew in relative protection
  • The exposed fish larvae were easy pickings for a variety of sea life
  • Fishermen’s livelihoods were destroyed.

This may be a vivid example of humans interfering and altering the balance of ecosystems and misunderstanding the importance of biodiversity.

Dr. Sylvia Earle, described as a “Living Legend” by the US Library of Congress, is a world-renowned oceanographer, explorer, author, and lecturer. In the early 1990s she was the Chief Scientist of the National Oceanographic and Atmospheric Administration in the US. In 2009 she won the prestigious TED prize. As part of the prize, she was able to share a wish, which captured some major concerns about dwindling ocean biodiversity and its importance to all life on earth:

reference:

http://www.globalissues.org/article/171/loss-of-biodiversity-and-extinctions

Tuesday, March 9, 2010

El Nino and La Nina Weather Disturbances, Typhoons (Phil Setting)

The El Niño Phenomenon


Tingnan ang buong laki ng larawan

The El Niño is an abnormal weather pattern caused by the warming of the Pacific Ocean. It is characterized by climatic aberrations around the world-warming in South America, torrential rains in North America, and drought in Southeast Asia and Australia. This phenomenon occurs every two to seven years.

Climatic Indicators of El Niño in the Philippines

  • delayed onset of the rainy season
  • early termination of the rainy season
  • weak monsoon activity
    • isolated heavy downpours with short duration
  • weak tropical cyclone activity
    • far tropical cyclone track
    • less no. of tropical cyclones entering the Philippine Area of Responsibility
    • less intense tropical cyclones
Severe droughts in the Philippines 1982-1983
  • drought damage to rice and corn cost more than P700 million
  • 450,000 hectares of land were affected
  • among the severely hit provinces were Central Luzon, Southern Tagalog, Northern Visayas and Western Mindanao
1992-1993
  • drought damage set back the agricultural sector by P4.1 billion
  • 478,000 metric tons of corn were destroyed
  • among the worst hit were South Cotabato, Isabela, Bukidnon, Maguindanao, North Cotabato and Cagayan
1997-1998
  • dry spell between June1997-1998; effects continued to be felt through September 1998
  • El Niño struck as the country was enjoying a continuous four-year growth
  • damage to agriculture amounted to P8.46 billion
  • 16 regions were affected

Effects of El Niño in the Philippines

  • drought
  • environmental effects
    • degradation of soil which could lead to desert-like conditions if persistent
    • effect on water quality like salt water intrusion
    • high forest/grass/bush fire risk
    • domestic water supply shortages
  • social effects
    • disruption of normal human activities
    • migration to urban communities
    • health problems
  • economic effects
    • unemployment
    • food shortages
    • significant reduction in the productivity and subsequent revenue of various industries


El Niño-related effects on a person's health Precautions
diseases related to water scarcity or shortage such as diarrhea and skin diseases conserve water; protect water sources from contamination
risk of paralytic shellfish poisoning (seafood may be contaminated by red tide blooms) watch out for shellfish ban updates
disorders associated with high temperatures: heat cramps, heat exhaustion, exertional heat injury and heat stroke drink more fluids, wear light clothing, avoid strenuous physical activity


Since January, 2.5 million tonnes of rice and corn have been lost in the northern regions. Drought is affecting the rest of the country with power cuts and water rationing, including in the capital. Some people turn to shamans. The bishop of Urdeneta urges people to have faith in Providence, and to do all they can to counter the effects of climate change.


Manila (AsiaNews) – An El Niño-induced drought continues to cause havoc in the northern Philippines. About 2.5 million metric tonnes of rice and corn were lost since the start of the year. Some 800,000 hectares of rice and cornfields have already been affected by the problem. Agriculture has already lost an estimated US$ 33 million, which could go as high as US$ 400 million if this weather pattern continues until July. Drought is also affecting the rest of the country. Regular power cuts are affecting industry and water rationing is creating hardships for the population.

“It is such a difficult situation because we have just survived the typhoons in October that destroyed 1.5 million metric tons of rice and countless basic infrastructures,” Joel Rudinas, an undersecretary at the Department of Agriculture, said Friday. “We are bracing for the worst.”

To deal with the situation, President Arroyo signed an order, asking utility companies to increase water and power supplies to the farming and fishing communities in 14 of the country’s 80 provinces, especially in the north.

Despite pledges of help, most people are resigned. “My family and I are praying to God for rain,” said Ramon Cruz from Urdaneta (North Luzon), one of the most affected promises, but “we are losing hope that crops can be saved.”

In the provinces of North Luzon, the lack of rain has pushed water level so low that the Binga and Magat dams, which provide power to a large area in northern Philippines, could soon be shut down.

“We may have to temporarily stop operation if the water level does not increase," said Mike Hosillos, spokesman for power-generating firm SN Aboitiz Power.

Hosillos, who is also SN Aboitiz Power vice-president for corporate services, said the company is willing to try anything to get water levels to increase, including performing rituals such as the traditional rain dance. “We have always respected the local traditions of the people here; we are one with the community," he said.

The Catholic Church has raised funds at the parish level to help the most affected farmers. With its presence, it has tried to keep up people’s spirits. “We must have trust in Providence,” said Mgr Jacinto Jose Aagcaoili, bishop of Urdaneta, and “do all we can to face the effects of El Niño.

British researchers at the Met Office Hadley Centre for Climate Prediction and Research had already predicted the return of El Niño back in August.

This cyclical climate pattern occurs every two to seven years. It is characterised by increases in temperatures of the usually cold waters of the eastern Pacific Ocean of the order of plus .5 Cº- 1.5 Cº. Changes in temperature modify normal ocean patterns, causing droughts in Asia and Africa, and heavy rains in South America.

In 1997 and 1998, global warming and El Niño caused a major drought in South-East Asia. The resulting fires destroyed thousands of hectares of forests, with billions of dollars in losses in agriculture.

El Niño
(The Warm Phase)

El Niño is a large scale oceanographic / meteorological phenomenon that develops in the Pacific Ocean, which is associated with extreme climatic variability; i.e., devastating rains, winds, drought, etc. It is the migration, from time to time, of warm surface waters from the western equatorial Pacific Basin to the eastern equatorial Pacific region, along the coasts of Peru and Ecuador. This condition can prevail for more than a year, adversely affecting economies in both local and global scales.

El Niño translates from Spanish as the "Boy Child" or the "Little One". It used to be considered a local event along the coasts Peru and Ecuador. The term was traditionally used by the Peruvian anchovy fishermen to describe the appearance of a warm ocean current flowing along the south American coast around Christmas time.

Under normal conditions, the prevailing southeasterly trade winds produce a surface current flowing toward the equator along the western South American coast. The waters leaving the coast are replace by colder waters from below (upwelling), which is rich in phytoplankton, the food source of anchovy.

The warm current (El Niño) temporarily displaces nutrient-rich upwelling cold water resulting in the heavy harvest of anchovies. The abundant catch, however, is shortlived. What follows is a sharp decline in the fish population , resulting in a lesser catch. At times, warming is exceptionally strong and ruins the anchovy harvest.


Characteristics of El Niño


- It occurs in the Pacific basin every 2 to 9 years;

- It usually starts during the Northern winter (December to February);

- Once established, it lasts until the first half of the following year,
although at times, it stays longer;

- It exhibits phase-locking in annual cycles (El Niño and rainfall

- fluctuations associated with it tend to recur at the same time of the
year; and

- It usually has a biennial cycle (El Niño events will often be preceded
and/or followed by La Niña).

Climatic Indicators of El Niño in the Philippines

Abnormalities such as:

- delayed onset of the rainy season
- early termination of the rainy season
- weak monsoon activity
*isolated heavy downpours with short duration
- weak tropical cyclone activity
*far tropical cyclone track
*less no. of tropical cyclones entering the PAR
*less intense tropical cyclones


Effects of El Niño in the Philippines

In the Philippines, drought events are associated with the occurrence of El Niño episodes. Second and third order impacts of El Niño related drought events in the Philippines include:

(a) environmental (degradation of soil which could lead to desert-like conditions if persistent, effect on water quality like salt water intrusion, high forest/grass/bus fire risk, domestic water supply shortages, etc.);

(b) social (disruption of normal human activities, migration to urban communities, human and health problems, etc.); and

(c) economic (unemployment, food shortages, significant reduction in the productivity and subsequent revenue of various industries, hydro-electric power generation, etc.).


La Niña

(The Cold Phase)

La Niña develops over the central and eastern equatorial Pacific and is characterized by unusually cold surface temperatures of the ocean. La Niña is associated with extreme climatic variability such as devastating rains, winds, drought, etc.

This condition can prevail for two to three seasons (six to nine months) thus affecting the economy on both the local and global scales. The term La Niña (the Little Girl) was used by many scientists and meteorologists to differentiate it from El Niño. It is sometimes called El Viejo (Old Man), Anti-El Niño, or simply "cold event" or "cold episode".

Southern Oscillation/Walker Circulation

La Niña events are also linked to a change in atmospheric pressure known as the Southern Oscillation (SO). This is characterized by a seesaw (positive) in the atmospheric pressure between the western and central regions of the tropical Pacific Ocean, with one center of action located in the vicinity of Indonesia and the other center located over the central Pacific Ocean. The index that measures the magnitude of the SO is known as the Southern Oscillation Index (SOI) and it is obtained by calculating the difference in atmospheric surface pressure between Tahiti and Darwin, Australia. The Southern Oscillation results from pressure variations which cause changes in the wind circulation, also known as the Walker circulation. In normal conditions, the prevailing wind comes from the southeast to east. During La Niña, stronger than normal easterly winds occur throughout much of tropical Pacific. These stronger winds push greater amounts of warm surface waters far into the western tropical Pacific. Below normal sea surface temperatures (SSTs) over eastern tropical Pacific and simultaneously above normal or positive anomaly SOI indicate a global-scale climate variation defined as the La Niña phenomenon.


Is La Niña a New Phenomenon?

La Niña is not a new phenomenon. Evidence suggest that La Niña events have existed for thousands of years in the past. However, it is only in the last decade that a satisfactory understanding of how they form and are maintained has been gained. Some of the La Niña events on record are 1955-56, 1964-65, 1970-71, 1973-74, 1975-76, 1988-1989 and 1995-1996.

How Are La Niña Events Detected?

La Niña events in the tropical Pacific Ocean can now be detected by many methods, including satellites, moored buoys, drifting buoys, sea level analysis and expendable bathythermographs. This research observing system is now evolving into an operational climate observing system. Large computer models of the global ocean and atmosphere use data from this observing system as input to predict/monitor La Niña, as well as El Niño. Other global models are used for research to further understand the phenomenon.

Are All La Niña Events The Same?

La Niña events share many general characteristics although every one is somewhat different in magnitude, duration and resulting global climatic impacts. Magnitude can be determined in different ways, such as variations in the Southern Oscillation Index (SOI). Another measure of the magnitude is the sea surface temperature anomaly (difference between the observed and average values) which could either be positive (hotter than normal) or negative (cooler than normal) over specific region of the Pacific ocean, particularly in central and eastern regions.

How Does La Niña Affect Our Climate?

Impacts of La Niña on Philippine climate include anomalies in rainfall, temperature and tropical cyclone activities. During La Niña conditions, major parts of the country experience near normal to above normal rainfall conditions particularly over the eastern sections of the country. La Niña conditions also favor tropical cyclone formation over the western Pacific which tend to increase the number of tropical cyclones.


La Nina's effects have begun in Philippines

December 1998

U.S. Water News Online

MANILA, Philippines (AP) -- Two intense typhoons that struck the Philippines are an indication that the ``La Nina'' weather phenomenon has begun affecting the country, the weather bureau said. ``It is here,'' said Ernesto Verceles, a weather specialist at the Philippines Atmospheric, Geophysical and Astronomical Services Administration.

``We should be ready for the worst,'' he said. ``The two previous storms were indications of things to come.'' Meanwhile, the death toll rose to 189 for Typhoon Babs, which hit the Philippines earlier. At least 74 died in Typhoon Zeb.

Last year, the Philippines suffered from a long drought attributed to the El Nino weather phenomenon, a result of higher temperatures in the Pacific Ocean. La Nina, attributed to an abnormal cooling of the sea surface, is expected to cause heavy rains for the rest of this year. The weather bureau expects that La Nina will intensify the effects of at least five more tropical storms expected to strike the country in coming months. Provinces on the east side of Luzon, the Philippines' main island, will feel the brunt of the storms, Verceles said.

``Storms from the Pacific will hit the area with force before they weaken after hitting the mountain ranges on their way west toward the South China Sea,'' he said. The weather bureau is preparing an advisory on La Nina's effects that will be issued to prepare residents living near rivers and along the coast, he said.

About 152 of the deaths last week from Typhoon Babs were recorded in the Bicol region on the eastern coast, where the storm came ashore. Emilia Tadeo, an official at the Office of Civil Defense, said rescue workers are still finding bodies under landslides in Catanduanes island in Bicol. At least 53 people are still missing from the storm, she said.


Sources: PAGASA, DOH, Philippine Council for Agriculture, Forestry and Natural Resources Research and Development; National Disaster Coordinating Council, Philippines Country Case Study: Impacts and Responses to the 1997-98 El Niño Event

reference:
http://www.gmanews.tv/story/52900/The-El-Ni&ntildeo-Phenomenon
http://www.asianews.it/news-en/As-El-Ni%C3%B1o-causes-droughts-and-power-cuts,-people-turn-to-shamans-and-prayers-17712.html
http://kidlat.pagasa.dost.gov.ph/cab/enso.htm
http://www.uswaternews.com/archives/arcglobal/8lanin12.html


Renewable-vs-non renewable resources (types and uses)

Renewable Resources

Renewable energy resources are natural resources that replenish themselves within time limits that permit sustained use, in contrast to nonrenewable resources. That is, resources can be replenished by natural process at least as fast as they are used. Therefore it can be used over and over again. Five types of renewable resources are: Wind Power, Hydropower, Solar Energy, Geothermal Energy, Biomass Fuel and Wood.

Hydropower
Hydropower is the capture of the energy of moving water (falling of water from one level to another) for some useful purpose. This falling of water can be natural falling source or from a dam. The falling water is used to turn waterwheels or modern turbine blades which is used to powering a generator to produce electricity. Hydropower system is a clean source of energy systems that can neither be polluted or consumed during its operation. It eliminates the cost of fuel, making it immune to price increases for fossil fuels. As long there is a water source (lake, river etc.) it is renewable.

Solar Energy
Solar energy is the energy from the sun ( in the form of heat and light) that is directly capture and converted into thermal or electrical energy and harnessed as solar power. Solar power is the technology of obtaining (harnessing) usable energy from the light of the sun. Some applications of solar energy are hot water heating and space heating in the home. It is also used in the application of solar panels where individual homes (in region where it is warm and sunny) convert solar energy into thermal energy to generate electricity.

The use of solar energy displaces conventional energy where it results in a proportional decrease in green house gas emissions. The energy from the sun is free with just the initial cost to set up the technology. The sun provides unlimited (renewable) supply of solar energy. The only draw back is that its requires a large area to collect the sun’s radiation and requires some means of storage.

Wind Power
Wind power is the conversion of wind energy into electricity using wind turbines (usually mounted on a tower). Wind power is used in large scale wind farms for national electrical grids. On a small scale it is also used to provide electricity to rural residences. Wind energy is ample, free, widely available, clean, renewable, produces no waste or greenhouse gases, need no fuel, good method of supplying energy to remote areas and can be a site for tourist attraction.


Biomass Fuel
Biomass Fuel (Biofuels) is any organic material produced by living organisms (plants, animals, or microorganisms) that can be burned directly as a heat source or converted into a liquid or gas. Some examples of biomass fuels are wood, crop residues, peat, manure, leaves, animal materials and other plant material.

There are two major sources of biomass;
i. trees, gains, sugar crops and oil-bearing plants.
ii. waste organic materials from industrial, commercial, domestic, or agricultural wastes. Examples, crop residues, animal wastes, garbage, and human sewage.

Biomass fuels (biofuels) are sustainable. It is cheap and is less demanding on the environment or Earth's resources. A major advantage of biomass fuel, is its low greenhouse gas emission characteristic where it adds less carbon to the environment when compared with burning fossil fuels. This is due to the fact that the carbon atoms released by burning biofuel already exists as part of the carbon cycle. Biomass absorbs an equal amount of carbon in growing as it releases when consumed as a fuel.

Fuel diversity is another advantage of biomass, it can be transformed into fuel in many ways such as in gasification, anaerobic digestion - fermentation of wet wastes (e.g. sugarcane or corn to produce alcohol (ethanol) and esters, and animal dung to produce biogas) and direct combustion - burning of dry organic wastes (e.g. wood and peat) just to name a few.

The use of biomass fuels can reduce dependence on foreign sources of oil whereby providing energy security for the country using it as a fuel. This will therefore promote an economic boost for both agriculture and the industry of that country. However, for it to be economical as a fuel for electricity, the source of biomass must be located near to where it is used for power generation.

Geothermal Energy
Geothermal Energy is power generated by the harnessing of heat from the interior of the earth when it comes to (or close to) the earth’s surface. The regions with highest underground temperatures are in areas with active or geologically young volcanoes. Chief energy resources are hot dry rock, magma (molten rock), hydrothermal (water/steam from geysers and fissures) and geo-pressure (methane-saturated water under tremendous pressure at great depths).

There are several methods of deriving energy from the earth’s heat where the heat energy that is generated by converting hot water or steam from deep beneath the Earth’s surface is converted into electricity. This hot water or steam come from a mile or more beneath the earth surface. geothermal applications includes:

i. Geothermal Electricity Production - generating electricity from the earth's heat. The steam rotates a turbine that activates a generator, which produces electricity.
ii. Geothermal Direct Use - Producing heat directly from hot water within the earth.
iii. Geothermal Heat Pumps - Using the shallow ground to heat and cool buildings.


reference:
http://www.myuniversalfacts.com/2007/11/types-of-renewable-resources-and-their.html


Non-Renewable Resources


Introduction

Worldwide there is a range of energy resources available to us. These energy resources fall into two main categories, often called renewable and non-renewable energy resources. Each of these resources can be used to generate electricity, which is a very useful way of transferring energy from one place to another such as to the home or to industry.

Non-renewable sources of energy can be divided into two types: fossil fuels and nuclear fuel.

Fossil fuels

Fossil fuels are found within the rocks of the Earth's surface. They are called fossil fuels because they are thought to have been formed many millions of years ago by geological processes acting on dead animals and plants, just like fossils.

Coal, oil and natural gas are fossil fuels. Because they took millions of years to form, once they are used up they cannot be replaced.

Oil and natural gas

What are they?

Oil and gas are chemicals made from molecules containing just carbon and hydrogen. All living things are made of complex molecules of long strings of carbon atoms. Connected to these carbon atoms are others such as hydrogen and oxygen. A simple molecule, called methane (CH4), is the main component of natural gas.

Crude oil (oil obtained from the ground) is a sticky, gooey black stuff. It contains many different molecules, but all are made of carbon and hydrogen atoms.

Organic materials are formed from chains of carbon atoms. Methane is the main component of natural gas

How were they formed?

Gas and oil were formed from the remains of small sea creatures and plants that died and fell to the bottom of seas. Over many millions of years, layers of mud or other sediments built up on top of these dead animals and plants. The pressure from these layers and heat from below the Earth's crust gradually changed the once-living material into oil and natural gas.

Over time, the layers of rocks in the Earth's crust move and may become squashed and folded. Gas and oil may move through porous rocks and may even come to the surface. In some places, pockets of oil and gas can be found, because non-porous rocks have trapped them.

Pockets of oil and natural gas may become trapped between layers of non-porous rocks.

Where are they found?

Natural gas and crude oil can be found in many places around the world, such as the Middle East (about 70 per cent of the world's known resources of oil), the USA and under the North Sea off the coast of the UK.

What are they like as fuels?

When gas and oil burn they produce mainly carbon dioxide and water, releasing the energy they contain. Crude oil is a mixture of different chemicals and is usually separated out into fuels such as petrol, paraffin, kerosene and heavy fuel oils.

The oil-based fuels provide less energy per kilogram than natural gas. Both oil and natural gas produce carbon dioxide, which is a greenhouse gas.

How long will they last?

Oil and gas are non-renewable: they will not last forever. New sources of oil and gas are constantly being sought. It is thought that the current resources under the North Sea will last about another 20 years and the world resources will last for about 70 years.

Estimates vary, however, because we do not know where all the resources are and we do know how quickly we will use them. It is thought that with new discoveries these fossil fuels will last well into the next century.

Advantages
These sources of energy are relatively cheap and most are easy to get and can be used to generate electricity.

Disadvantages
When these fuels are burned they produce the gas carbon dioxide, which is a greenhouse gas and is a major contributor to global warming. Transporting oil around the world can produce oil slicks, pollute beaches and harm wildlife.

Coal

What is it?

Coal mainly consists of carbon atoms that come from plant material from ancient swamp forests. It is a black solid that is reasonably soft. You can scratch it with a fingernail. It is not as soft as charcoal, however, and is quite strong. It can be carved into shapes. There are different types of coal. Some contain impurities such as sulphur that pollute the atmosphere further when they burn, contributing to acid rain.

How was it formed?

Millions of years ago, trees and other plants grew rapidly in a tropical climate, and when they died they fell into swamps. The water in the swamps prevented the plant material from decaying completely and peat was formed.

As time passed, layer upon layer of peat built up. The pressure from these layers and heat from below the Earth's crust gradually changed the material into coal.


Coal was formed from the remains of ancient plants.

Where can it be found?

Coal can be found in parts of the world that were once covered with swampy forests, such as the UK about 250 million years ago. There are large deposits in China, USA, Europe and Russia. South Africa also has relatively large deposits.

What is it like as a fuel?

When coal burns it produces mainly carbon dioxide, some carbon monoxide and soot (which is unburned carbon). Many coals when burned produce smoky flames.

Their energy content weight for weight is not as great as oil. When coal burns it produces more carbon dioxide than oil.

How long will the supply of coal last?

The world has relatively large reserves of coal, more so than oil and gas. Estimates vary, but suggestions are that supplies will last well into the next century.

Advantages
Coal is relatively cheap, with large deposits left that are reasonably easy to obtain, some coal being close to the surface. It is relatively easy to transport because it is a solid.

Disadvantages
Some sources of coal are deep below the ground, as in the UK. They can be difficult, costly and dangerous to mine.

Burning coal without first purifying it contributes to global warming, as well as to the production of smog (smoke and fog), which is harmful to health. It is a finite resource and will eventually run out.

Nuclear fuel


What is it?

Nuclear fuel makes use of the radioactivity of some elements. The nucleus in the atom may spontaneously break down to release energy and produce fast-moving particles, atoms of other elements. The fast-moving particles that are ejected can also strike other atoms, causing them to break down.

Placing the atoms close together in a fuel rod means that atoms are more likely to be struck by these particles, and so produce more nuclear reactions. As the reactions proceed heat is produced. The task of a nuclear reactor is to control the reaction so that a steady flow of heat is produced.

How is nuclear fuel made?

Nuclear fuel is made from naturally occurring radioactive materials, such as uranium, found in rocks. These materials are extracted and concentrated. They are formed into 'fuel rods'.

When placed close together, the fuel rods set off nuclear reactions that generate heat. This heat is used to turn water into steam and generate electricity.

This fuel is classed as non-renewable, although concentrating the fuel further can recycle some of the 'spent fuel'.

Radioactive materials are concentrated into fuel pellets and formed into fuel rods in a nuclear reactor.

Where can nuclear fuel be found?

There are deposits of the raw material uranium in Africa, Russia and North America.

How long will the supply of nuclear fuel last?

The world supply of radioactive material will provide a source of energy well into the next century and beyond.

Advantages
Nuclear fuel does not produce greenhouse gases, so will not contribute to global warming. There is a relatively long-lasting supply of raw material.

Disadvantages
The waste remains radioactive for a long time (100+ years). If the reaction is not contained and controlled well, then the nuclear reduction could go out of control, as at Chernobyl in 1986. Radioactive material could then escape into the environment.

reference:

http://www.scienceonline.co.uk/energy/nonrenewable.html

Mineral Depletion, Deforestation, Coral Bleaching, Mangrove Ecosystem


SOIL MINERAL DEPLETION

Can a healthy diet be sufficient in today's world?

There was a time when simply eating a healthy diet and avoiding all anti-nutrients ensured that we got all the minerals needed to stay healthy - research today shows that this may no longer be the case as the nutrient content of our food is on the decline.

Soil is the prime source of minerals on which every living cell depends for its structure and function. Vitamins, enzymes, amino acids (protein) and a host of other biologically active substances are essential for our bodies to function properly. They virtually all include minerals as an integral part of their chemical structure. Dr Linus Pauling, twice noble prize winner, said “you can trace every sickness, every disease and every ailment to a mineral deficiency”. Yet, all over the world, minerals are disappearing from agricultural soils at an alarming rate. In 1992, the official report of the Rio Earth Summit concluded “there is deep concern over continuing major declines in the mineral values in farm and range soils throughout the world”. This statement was based on data showing that over the last 100 years, average mineral levels in agricultural soils had fallen worldwide – by 72% in Europe, 76% in Asia and 85% in North America. What has caused this staggering decline?

Most of the blame lies with artificial chemical fertilisers. We now know that plants absorb 70 to 80 different minerals from the soil, while the number returned to it by plants grown with commercial fertilisers can be counted on the fingers of one hand. Every crop that is cut or animal that is sent to market marks a further depletion in the mineral status of the soil on which it was raised. Organic wastes that in former times would have been composted and returned to the land are nowadays mostly consigned to landfill sites or incineration.

There are many other ways in which the move to chemical farming prevents crops from taking up even the sparse amounts of trace minerals left in the soil. Soil contains bacteria, fungi, plant and animal life, in a state of constant interaction and balance. Every one of these organisms needs dozens of different minerals to survive and play its part in the ecosystem. Some bacteria have a vital role in converting soil minerals into chemical forms that plants can use. NPK fertilisers (fertilisers used in modern farming that only contain nitrogen, phosphorous and potassium) gradually change the soil pH towards acidic conditions in which these bacteria can not survive. To combat soil acidification farmers lay lime on the land adding back calcium and magnesium to raise the soil pH, but it also converts manganese and some other trace minerals into chemical forms that plants are unable to absorb.

Pesticides and herbicides also reduce the uptake of trace minerals by plants. Plants have an important relationship with certain fungi that can form networks covering several acres. The fungus obtains carbohydrates from the plant root, at the same time supplying the plant with nutrients it draws from the soil. This gives the plant access to a vastly greater mineral extraction system than is possible by their roots alone. Chemical fungicide sprays destroy these beneficial fungi and so again reduce the ability of plants to absorb soil minerals. Insecticides can also reduce trace mineral uptake by inactivating choline-containing enzymes in plants, essential for the absorption of manganese and other minerals.

The combined effect of soil mineral depletion and the reduced availability of those minerals that remain is that most of the food that we eat is mineral deficient. The table below summarizes the reductions in the average mineral content of 27 vegetables and 17 fruits, between 1940 and 1991. The results of the latest research are expected to show mineral values in continual decline.

Reduction in average mineral content of fruit and vegetables between 1940 and 1991

Mineral


Vegetables


Fruit

Sodium
-49%
-29%
Potassium
-16%
-19%
Magnesium
-24%
-16%
Calcium
-46%
-16%
Iron
-27%
-24%
Copper
-76%
-20%
Zinc
-59%
-27%


A new study published earlier this year shows that, as might be expected, mineral levels in animal products reflect the picture in plant foods. Comparing levels measured in 2002 with those present in 1940, the iron content of milk was found to be 62% less, calcium and magnesium in parmesan cheese had each fallen by 70% and copper in dairy produce had plummeted by a remarkable 90%.

The UK government is putting resources into improving health by encouraging people to eat a healthy diet, including 5 portions of fruit and vegetables per day, but you scarcely hear a word about the problem of soil mineral depletion. Food seems to be considered as something quite separate from its source and means of production. But this is not rocket science – the foundation of human health is the quality of the food we eat, which relies ultimately on the vitality of the soil on which it is raised.

Minerals are needed for the proper formation of blood and bone, the maintenance of healthy nerve function, heartbeat regulation, reproduction and foetal development. They are essential to the process of growth, healing and energy release. And it is not just the presence of the mineral in the body that is important – they must be in the correct ratio to each other. The level of each mineral has an effect, directly or indirectly, on every other, so if one is out of kilter the whole system is affected.

Minerals are an essential part of our natural diet and a lack of them may in part account for our increasing susceptibility to the “diseases of civilisation” – such as heart disease (magnesium), cancer (selenium), diabetes (chromium) and mental illnesses (zinc). Every one of us should take care to get the minerals we need, for the good of our health.

What can you do to ensure you get the minerals you need?

Eat organic
Organic foods generally have higher levels of minerals than those grown with chemicals.

Look to the sea
A fter all this is where many minerals lost from the soil end up! Sea vegetables are particularly high in minerals. For instance, dulse seaweed contains 75 times as much iron as spring greens. Shellfish also contain good amounts of mineral especially zinc.

Take supplements
L ook for supplements that have minerals in a chelated form, or as orates, citrates or gluconates. Alternatively colloidal minerals are a good bet.

Grow your own
If your garden has not been used for growing vegetables or if you have been doing so organically, the soil is likely to be much richer in minerals than agricultural land. You won’t be able to grow all your food this way, but what you grow will be far superior nutritionally to anything you buy at the supermarket.

Campaign
Get in touch with the Soil Association or the Food Commission to get further information and find out what you can do to raise awareness of the problem of nutrient depletion. Write to your local MP or supermarket, and talk to anyone who will listen!

reference:

http://www.physicalnutrition.net/soil-mineral-depletion.htm


What is Deforestation?

Deforestation refers to the cutting, clearing, and removal of rainforest or related ecosystems into less bio-diverse ecosystems such as pasture, cropland, or plantations (Kricher, 1997).

What are the causes of deforestation?

I. Logging

II. Mining

III. Oil and gas extraction

IV. Cattle ranching

V. Agriculture: Cash crops

VI. Local, National, and International factors: development, land titles, government subsidies to attract corporations into developing countries, trade agreements (NAFTA, CAFTA), civil wars, debt, lack of resources, and lack of law enforcement.

Largest rainforests worldwide listed in descending order (from largest to smallest).

  1. Amazon basin of South America
  2. Congo river basin of Central Africa
  3. S.E. Asia
  4. New Guinea
  5. Madagascar

Facts:

  • Did you know that tropical rainforests, which cover 6-7% of the earth's surface, contain over half of all the plant and animal species in the world!
  • Did you know that 57% of all rainforests remaining are located in the Neotropics, with 30% located in Brazil.

Overview of deforestation around the world:

Between 1960 and 1990, most of the deforestation occurred globally, with an increasing trend every decade.

  • Brazil has the highest annual rate of deforestation today.
  • Atlantic coast of Brazil has lost 90-95% of its rainforest.
  • Central America has 50% of its rainforests.
  • South America has 70% of its rainforests.
  • Philipines have lost 90% of its rainforests!
  • Madagascar has lost 95% of its rainforests!
  • El Salvador has lost 70-85% of its rainforest due to heavy bombing during the civil war 1984-1985.
  • Sumatra has 15% of its rainforests left.
  • Only 6% of Central Africa's forests are protected by law.

Statistics on Global Rates of Rainforest Destruction:

2.4 acres (1 hectare) per second: equivalent to two U.S. football fields

149 acres (60 hectares) per minute

214,000 acres (86,000 hectares) per day: an area larger than New York City

78 million acres (31 million hectares) per year: an area larger than Poland

On average, 137 species become extinct everyday; or 50,000 each year!

*If the current rate of deforestation continues, the world's rain forests will vanish within 100 years- causing unknown effects on global climate and eliminating the majority of plant and animal species on the planet*

What are the consequences of deforestation?

Environmental:

  1. Extinctions (loss of biodiversity of microbes (bacteria), plants, insects, animals, indigenous peoples, etc.
  2. Habitat fragmentation. This disturbes the animals' habitat and may force them to enter habitats which are already occupied. This can pose many problems such as territorial conflicts, homelessness (loss of habitat), lack of food availability, migration disturbances, etc.
  3. Soil erosion occurs when trees and plants are removed; the rain water washes the nutrients in the top soil away.
  4. Changes in watershed geomorphology.
  5. Desertification (dry, hot, arid conditions).
  6. Edge effects can change microclimates (small climates) which affect endemic species (native species which can only live in specific environmental and habitat conditions).
  7. Climate change (more carbon dioxide is released into the atmosphere, thus increasing the effects of global warming).
  8. Pollution (ground, water and air pollution from oil extraction and mining chemicals).

Social impacts:

  1. Loss of culture (indigenous peoples subsistence living in the rainforest). People who live in the rainforest depend on the natural environment for food, shelter, materials for cooking, clothing, etc. If the forest is cut down or if their environment becomes polluted from oil extraction and mining, they are forced to move or risk starvation and sickness.
  2. Displacement of people (loss of farmland, forest resources, etc).
  3. Social conflicts and struggles over land and natural resources.
  4. Conflicts over racial and ethnic rights.
  5. Poisoning from oil and mining waste.
  6. Economic uncertainty (price fluctuations and high interest rates on outstanding international loans with The World Bank and International Monetary Fund.

What can we do to STOP or at least lessen the amount of deforestation and conserve our own use of natural resources such as wood, oil and gas, electricity, minerals and elements, and water? Brainstorm...here's a start:

  • Always use both sides of paper when writing, drawing, photo-copying, faxing, etc.
  • Recycle paper, cans, glass, and plastic.
  • Read the newspaper on-line.
  • Buy paper products made from recycled paper: notebook paper, paper towels, toilet paper, books, etc.
  • Use pencils until they are stubs! Think of pencils as gold (you'll never lose them if you do).
  • Encourage your parents, relatives, and friends to buy furniture and wood that is Certified. That means the wood was legally cut-down.
  • If you buy a product and you notice they use wood chips to package it, write to the company and suggest they use another packaging material.
  • Trees get cut down for cattle to graze. Instead of eating meat, think of eating other sources of protein such as fish, soy, beans, whole-wheat, and nuts.
  • Buy organic fruits and vegetables. That means there are no insecticides or pesticides (poisonous chemicals) sprayed on the food. If these chemicals kill insects and pests that try and eat the vegetables, think about how harmful they can be to you and the environment.
  • Instead of buying gold or diamonds, which are mined and cause environmental damage, consider jewelry that is made from materials that are not mined...such as glass.
  • Encourage your parents, relatives, and friends to drive fuel efficient cars that get good gas mileage. Hybrid and bio-diesel cars get great mileage and use less or no gasoline.
  • Even better, whenever possible, walk, bike, carpool or use mass transit (bus or train).
  • Save electricity by turning off lights, t.v., radio, computer, etc when you are not using them.
  • Save water by NOT taking baths; instead take quick showers (turning off the water while you soap up) and then turning it back on to rinse quickly.
  • While washing your hands and brushing your teeth, turn off the water. You'll save gallons if you do.
  • When washing the dishes or your parent's car, turn off the water while washing it with soap. Rinse quickly after washing.
  • Hmmm, can you think of other ways to conserve wood, oil and gas, electricity, minerals and elements, and water, etc...? Brainstorm with your pen pal or a family member.

reference:

http://kids.mongabay.com/lesson_plans/lisa_algee/deforestation.html


Coral Bleaching


Bleached corals

Coral bleaching
is the whitening of corals, due to stress-induced expulsion or death of symbiotic, algae-like protozoa, or due to the loss of pigmentation within the protozoa.[1] The corals that form the structure of the great reef ecosystems of tropical seas depend upon a symbiotic relationship with unicellular flagellate protozoa, called zooxanthellae, that are photosynthetic and live within their tissues. Zooxanthellae give coral its coloration, with the specific color depending on the particular clade. Under stress, corals may expel their zooxanthellae, which leads to a lighter or completely white appearance, hence the term "bleached".[2]

Once bleaching begins, it tends to continue even without continuing stress. If the coral colony survives the stress period, zooxanthellae often require weeks to months to return to normal density.[3] The new residents may be of a different species. Some species of zooxanthellae and corals are more resistant to stress than other species.

Causes of coral bleaching

Coral bleaching is a vivid sign of corals responding to stress, which can be induced by any of:

Temperature change

Unbleached (left) and bleached (right) coral

Temperature change is the most common cause of coral bleaching.[4]

Large coral colonies such as Porites are able to withstand extreme temperature shocks, while fragile branching corals such as table coral are far more susceptible to stress following a temperature change.[10] Corals consistently exposed to low stress levels may be more resistant to bleaching.

Factors that influence the outcome of a bleaching event include stress-resistance which reduces bleaching, tolerance to the absence of zooxanthellae, and how quickly new coral grows to replace the dead. Due to the patchy nature of bleaching, local climatic conditions such as shade or a stream of cooler water can reduce bleaching incidence. Coral and zooxanthellae health and genetics also influence bleaching.[11]

Monitoring reef sea surface temperature

The US National Oceanic and Atmospheric Administration (NOAA) monitors for bleaching "hot spots", areas where sea surface temperature rises 1 degree Celsius or more above the long-term monthly average. This system detected the worldwide 1998 bleaching event,[12][13] that corresponded to an El Niño. NOAA also uses a satellite with 50k resolution at night, which some argue covers too large a spatial area and does not detect the maximum sea surface temperatures occurring usually around noon.[citation needed]

Changes in ocean chemistry

Increasing ocean acidification likely exacerbates the bleaching effects of thermal stress.[14]

Infectious disease

Bioerosion (coral damage) such as this may be caused by coral bleaching.[15]

It was discovered in 1996 that the bleaching agent of Oculina patagonica in the Mediterranean Sea was infectious bacteria attacking the zooxanthellae.[16] The bacteria were later identified as Vibrio shiloi.[14] V. shiloi is infectious only during warm periods. Elevated temperature increases the virulence of V. shiloi, which then become able to adhere to a beta-galactoside-containing receptor in the surface mucus of the host coral.[14][17] V. shiloi then penetrates the coral's epidermis, multiplies, and produces both heat-stable and heat-sensitive toxins, which affect zooxanthellae by inhibiting photosynthesis and causing lysis.

During the summer of 2003, coral reefs in the Mediterranean Sea appeared to gain resistance to the pathogen, and further infection was not observed.[18] The main hypothesis for the emerged resistance is the presence of symbiotic communities of protective bacteria living in the corals. The bacterial species capable of lysing V. shiloi has not been identified.

reference:

http://en.wikipedia.org/wiki/Coral_bleaching


Mangrove Ecosystem

Shorelines

Mangrove Forests

Mangrove RootsMangrove forests thrive near the mouths of large rivers where river deltas provide lots of sediment (sand and mud). Mangrove roots collect sediments and slow the water's flow, helping to protect the coastline and preventing erosion. Over time, the roots can collect enough debris and mud to extend the edge of the coastline further out.

Mangrove forests are teeming with life. Shorebirds, crab-eating monkeys, and fishing cats all make the mangrove home. Mangroves provide a safe haven and a nursery for a variety of fish, birds, crustaceans, and shellfish.

Mangrove Trees
A mangrove is a tropical maritime tree or shrub of the genus Rhizophora. Mangroves have special aerial roots and salt-filtering tap roots that enable them to thrive in brackish water (brackish water is salty, but not as salty as sea water).

There are several species of mangrove trees found all over the world. Some prefer more salinity, while others like to be very close to a large fresh water source (such as a river). Some prefer areas that are sheltered from waves. Some species have their roots covered with sea water every day during high tide. Others are more sensitive to salinity, and grow closer to the shore. Other species grow on dry land, but are still part of the ecosystem.

Mangroves need to keep their trunk and leaves above the water line. Yet they also need to be firmly attached to the ground so they are not moved by waves. There are three types of mangrove roots that help in this process:

Mangroves
1. Support roots which directly pierce the soil.

2. Level-growing roots which twist upward and downwards, with the upward twists emerging on the water surface.

3. Level-growing roots whose downward twists (sub-roots) appear on the water surface.

Any part of a root that appears above the water line channels oxygen to the plant below the water line. Over time as soil begins to build up, these roots produce additional roots that become embedded in the soil.

Where Are Mangroves Found?
There are 15.9 million hectares (over 60,000 square miles) of mangrove forests in the warm waters of tropical oceans all over the world. Along the Atlantic coast they are found from Florida all the way down to Argentina. Mangroves grow on both the western and eastern coasts of Africa. They stretch into India, Burma, and south-east Asia. Mangrove forests are also common in New Zealand and Australia.

Saving the Mangroves
For centuries mangrove areas have been used for timber, mining, agriculture, harbor development and human settlements. Mangrove areas were used for commercial shrimp farming during the late 70's and early 80's. However, using mangrove areas for shrimp farming proved to be unsustainable.

Many governments have realized how necessary mangroves really are to the overall environment and have adopted mangrove restoration and conservation programs. Strict legislation to protect mangroves is in place in many countries.

Indonesia is home to over a quarter of the world's mangrove population. Coastal fish farmers on the Indonesian island of Java are given 4–5 hectares of land, but are required to plant mangroves on 20% of it. Seeds are gathered from budding sprouts and planted 6 to 9 feet apart. This sort of reforestation improves the environment, while feeding people and encouraging the economy. This is a sustainable long term solution.

reference:

http://www.mbgnet.net/salt/sandy/mangroves.htm